Symbols ( a is used instead of alpha)
m = large number of experiments
(p-values)
m0 = number of true null
hypotheses in m
m1 = number of true alternative
hypotheses in m
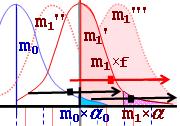
m = m0+m1 ; m1
= m1' +m1'' +m1'''....(etc.)
S = F+T = number of significant results
(discoveries) at the level a0
in m
F = number of false discoveries in S
T = number of true discoveries in
S
a
= F/m0
= significance level, i.e. proportion of false discoveries in m0
a =
probability that a 100×(1-a)-percent confidence interval (in m0 or m1) is false;
i.e. proportion of false 100×(1-a)-percent confidence intervals in m such intervals
f = T/m1 = proportion of
true discoveries in m1
F = a0×m0
; T = f × m1
Q = F/S = actual (or nearly-exactly
estimated) proportion of false discoveries in S
Qmg (= "Q-maximal-graphical") =
estimate of Q obtained from a histogram
Qmax = estimate of Q obtained
from known values m, S, a (as in my paper
published in JASA, 1989 - see below: Ref. 1.)
E = proportion
of false 100×(1-a)-percent confidence
intervals in S intervals
Emax = calculated largest expected value of E
Emin = calculated smallest expected value of E
In a large known number (m) of experiments, a0 and a are known, and the number (S) of significant results (in which p<a) is also known (because it can be enumerated). In the case that Q can
be nearly-exactly estimated, we can also nearly-exactly calculate the proportion (E) of false confidence intervals (in S):
(See derivations below !)
E = [QS + (S-QS)×a/f ] / S ............. (1)
In (1) a and S are known, Q is also known if it can be estimated
with a satisfactory precision, and f can
be calculated from the following formula:
f = (S-QS) / [m -(QS/a0)] .............. (2)
where S, Q, m and a0 are known.