However, in fact, we don't need
Qmax or the calculation below** because
we can find Qmg' directly from the histogram!***
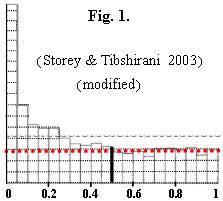
Storey and Tibshirani (as well
as others) calculate the q-values (or the FDR, etc.), although it seems that the proportion of false discoveries (Qmg) can
directly and simply be found from the histogram(?). Do q-values give better (smaller) estimates of the true proportion of false discoveries than the Qmg?
__________________________________________________________________
** Qmg = F/S = F/ (F+T) ; Qmax
= [(m/S)-1] / [(1/a)-1]; a = 0.5 ; a' = 0,05
If
m1-T = 0, then Qmg =Qmax (as explained on the page "Qmg & Qmax").
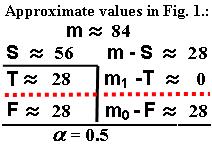
We know the following approximate values (in thousands):
m
= 84 , S = F+T = 56 (for a = 0.5),
S' = F'+T' = 16.5 (for
a' = 0.05)
If we take: a = 0.5 (in the case shown in Fig. 1. above) and if m1-T = 0,
then we find: Qmg = Qmax
= [(m/S)-1] / [(1/a)-1] = 0.5 . This may be far from the actual proportion of false discoveries, but we can improve
the estimate by proceeding to the "second step":
F/S
= Qmax; F =S×Qmax =56×0.5 =28 ; F'=
F×a'/a = S×Qmax×a'/a = 2.8
Qmax'
= F'/ S'
; Qmax' (= Qmg') = (S / S')×Qmax×a'/a = 2.8/16.5 = 0.1697
____________________________________________________________________
*** Alternatively,
we find directly from the histogram (approximately):
m0 -F = 28 ; F' = 2×(m0 - F)×a'= 56×0.05 = 2.8 ;
Qmg' = F'/S' = [2×(m0 -
F)×a'] / S' =
2.8/16.5 = 0.1697 (in 16,500 p-values)
----------------------------------------------------------------------------------------------------------
So, the Qmax method, and especially the improved "two-step
Qmax method", can sometimes be as good as the "Qmg graphical method", but the former methods seem to be unnecessary, because
they have no advantage over Qmg, which, moreover, is simpler to estimate!
____________________________________________________________________
Below is a result (FDR) obtained by applying the Benjamini-Hochberg method to the same example (Fig. 1. in the paper
by Storey and Tibshirani)!
We choose, say, alpha = a
= 0.05 and apply the Benjamini-Hochberg method:
p23500 = 0.1 >
(23500/ 84000)×0.05 = 0.014
p16500 = 0.05 >
(16500/ 84000)×0.05 = 0.0098
Hence, the set of p-values has to be smaller than 16,500 in
order that the null hypotheses can be rejected at the level a = 0.05 ; so, perhaps
we could reach
FDR
= 0.05 - but only for a much
smaller set!
On the other hand, if we choose alpha = a = 0.255 we have:
p23500
= 0.1 > (23500/84000)×0.255= 0.071
p16500 = 0.05 <
(16500/84000)×0.255= 0.0501
FDR
= 0.255 for the set of 16,500 p-values (approximately);
(FDR >
Qmg' = Qmax')
Is the above calculation correct or wrong? Please, tell me if I have
mistakenly applied the Benjamini-Hochberg method!
I also beg you to answer this question:
In the above example, can the calculation of q-values, or
any other methods for estimating the proportion of false discoveries, give better results than the histogram (i.e. Qmg method);
or, perhaps, are all such methods no better than Qmg, at least in very large sets of p-values?
______________
REFERENCES:
1. Sorić, B. (1989). Statistical "discoveries" and effect-size
estimation. J. Amer. Statist. Assoc., 84, 608-610. http://www.jstor.org/pss/2289950
2. Storey JD, Tibshirani
R. (2003) Statistical significance for genome-wide studies. Proc Natl Acad Sci 100: 9440-9445. http://genomics.princeton.edu/storeylab/papers/Storey_Tibs_PNAS_2003.pdf
I beg to be notified about any
mistakes that may exist above!
branko.soric@zg.t-com.hr
Go to:
Home , Qmg & Qmax
---------------------------------------------------
June - September, 2009
Branko Soric
................................................................................................................................................................
................................................................................................................................................................