|
Welcome! Here you can read about some of the fallacies in today's
statistical inference.
This text is written by dr.med. Branko Soric
e-mail address: branko.soric@zg.t-com.hr
Note: In this text the Greek letter alpha is replaced by the following symbol: ¤
The exponents are denoted
by ^ ; for example: 10^-6 = 0.000001 (= "ten to minus sixth power"). Instead of subscripts, numbers follow after letters,
e.g.: r1, r2, ¤1, ¤2; likewise: Qmax.
Zagreb, March - June 2001
Branko Soric:
THE
SCIENCE IS INSUFFCIENTLY VERIFIED STATISTICALLY
(IT IS NECESSARY EITHER TO CALCULATE A MAXIMAL PERCENTAGE
OF FALSE DISCOVERIES, OR TO ATTAIN HIGHER SIGNIFICANCE LEVELS IN SINGLE EXPERIMENTS)
A SURVEY (SUMMARY)
Contradictory
opinions have been expressed about the reliability and correctness of statistical testing. We do not know today how much truth
there is in parts of medicine (as well as other sciences) that have only been "verified" statistically, without any other
more reliable proofs. With chosen statistical significance levels, such as 5% or 1%, the percentage of untruth can easily
be greater than 10%, or 20%, or 50% ... However, we should KNOW that the percentage of fallacies is smaller than 1% (or, perhaps,
5%) - because the science should comprise known facts, and not the unknown! It is necessary to correct statistical textbooks
as well as the practice.
Karl Pearson, having investigated the correctness of the Monte Carlo roulette in 1894, discarded
a null hypothesis on the ground of an extremely small probability (far less than 10^-9 or one in a thousand million) that
the observed phenomena could randomly occur with an unbiased roulete. Namely, because such occurrences were "practically impossible"
with an unbiased roulette, he inferred that the roulette must be biased. (Note: A null hypothesis is an assumption that some
phenomenon or effect does NOT exist. To reject a true null hypothesis means to make a false dicovery).
Later, the
statisticians have (unjustifiably!) greatly loosened the criterion for discarding a null hypothesis, in order to more-easily
achieve "statistical verification" of statements i.e. to make more scientific discoveries. An event with a probability of
about 0.1% could hardly be called "practically impossible"! Still, the statisticians now say that even a 5-percent probability
is good enough to discard a null hypothesis! This seems to have rendered the today's science insufficiently credible. In the
last ten or more years (as far as I know) neither the research practice nor the statistical textbooks have been made any better.
If there is a large number (a) of true null hypotheses in a very large number (n) of independent experiments, and
if these n experiments produce r results ("discoveries") significant at the level ¤ (=alpha), then the probability that a
discovery is false is not ¤ (as is often imagined) but it is: ¤a/r = ¤a/(¤a+fb) (and this is different from ¤, except if a
= r; but this may not be so, and this is also unknown to us, because "a" is an unknown number). (See Figure 1).
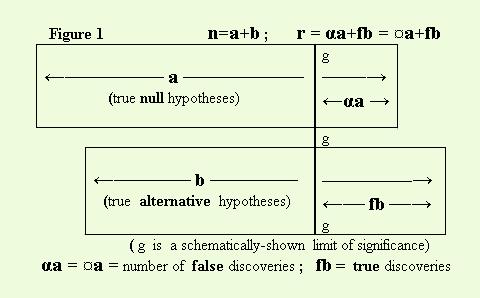
¤a = number of false discoveries;
fb = number of true discoveries; a+b=n
In previously published papers (Soric B., 1981 and 1989; see below: References)
I explained how to calculate a maximal percentage (or proportion, Qmax) of false discoveries in a very large set of statistical
discoveries (or, if the set is somewhat smaller, an approximate value of Qmax can be calculated) using the there-published
formula. Also, I gave there a simple derivation of the formula. (Although the derivation is simple, still - as far as I know
- no similar derivation or such a formula had been published before). Here is the formula:
Qmax = ¤(a,max)/r = [(n/r)-1]/[(1/¤)-1]
(where ¤ stands instead of "alpha").
That formula in fact applies to infinitely large sets of experiments. It
can render only approximate values of Qmax for sets amounting to several thousand experiments. Still, for such sets, a practically-largest-possible
Qmax value can be calculated exactly enough (as will be shown in a more extensive text).
In a favourable case, i.e.
if the Qmax is found to be small enough, it means that we have obtained a useful information. In the opposite case, if the
Qmax value is too large, it is not necessary to definitively discard the whole set of discoveries, but these discoveries require
an additional verification.
The true (unknown) Q value can be smaller than the calculated Qmax value. For example,
if we obtain Qmax = 30%, it is possible tha Q is less than 5%, or even less than 1%. Such a possible failure to become cognizant
of an actually satisfactory Q value is not necessarily so great a disadvantage as it may seem; because, in fact, our situation
is generally not good enough! Namely, it is not very useful to learn the percentage of true dicoveries in a large set r without
knowing the average difference between populations (i.e. the average effect size) in the set of true discoveries. If this
average effect size is negligibly small, such true discoveries can hardly be useful to us. However, unfortunately, whenever
we obtain a result significant at the 5-percent level (or 1-percent level, or the like), such an obtained statistical significance
level contains no information about the effect size! We can easily be wrong in believing that an effect size is larger than
zero, so we are even less justified in supposing that an effect size exceeds some definite larger-than-zero value. For the
same reason the 95-percent (or 99-percent) confidence intervals do not provide any additional information about the effect
size. (Explanations will be given in a more extensive text).
Of what avail would it be to make 100 discoveries with
only one of them being false, if the populations in the remaining 99 true discoveries would practically not differ from the
null populations?! Taking that into account, the apparent disadvantage (mentioned above) might in fact be considered to be
an advantage: namely, it is not bad to rely upon a calculated Qmax value, because, if the difference between Qmax and Q is
greater (i.e. if Q becomes smaller in comparison with Qmax), the average effect size in the set of discoveries (r) becomes
smaller. In an extreme case the average effect can even be negligibly small. So, there would not necessarily be much damage
even if such discoveries were lost. However, they don't have to be lost, because we can further test and verify them.
In
the opposite case, if a very small Qmax value is obtained, we know that the average effect is not negligible (and it can even
be large), because it corresponds to to the average power of the used statistical tests, which is f > r/n (the value r/n
is known in such a case).
In a SINGLE experiment it is important to attain a very high (or even an extremely high)
significance level - i.e. a very small p value (smaller than a very small probability ¤ [=alpha]), because that makes possible
to assess the effect size. For example: If 20% of untreated patients die (of a certain disease), and if an investigation shows
that only 14% of 5000 treated patients died - which is extemely significant (p = 4×10^-26) - then we can reject not only the
null hypothesis (implying 20% of deaths among the treated patients) but also a hypothesis about 17% of deaths in the treated
population can be rejected, because p is still very small (p = 2×10^-8). Thus we learn that the treatment saves 3% of the
patients, which means that the effect size is not only larger than zero but is also larger than 3%.
Perhaps, the greatest
problem is, that we cannot even rely on the truth of the gathered data that are to be statistically elaborated. It happens
not seldom that untrue or "strained" data are used either unintentionally or consciously, which makes it easy to achieve new
"discoveries". There are also fallacies on the part of some other experts who sincerely intend to be quite objective. (A few
axamples will be given in the more extensive text. Such is, e.g., the fallacy about 95-percent or 99-percent confidence intervals
which are imagined to make possible assessing the effect sizes of not-very-highly significant "discoveries").
It seems
to me that some experts do not quite understand what exactly should be written and explained in every textbook of statistics,
which is the following:
IT IS WRONG (AT LEAST IN THE TODAY'S SITUATION) TO REJECT A NULL HYPOTHESIS, IN A SINGLE EXPERIMENT,
ON THE GROUND OF A RELATIVELY LOW LEVEL OF STATISTICAL SIGNIFICANCE (FOR EXAMPLE 5%, PERHAPS ALSO 1%)!
That is wrong because
today the risk is unknown (as distinguished from what is written in textbooks!).
A more correct proceeding would be
this:
EITHER (1) we should consider the number (r) of significant results ("discoveries") obtained in a known large number
(n) of experiments and hence (approximately) calculate the maximal percentage (Qmax) of false discoveries among all the r
discoveries,
OR (2) we should reject a null hypothesis in a SINGLE experiment only on the ground of a much-higher
significance level (than those levels that are currently usual) i.e. a much-smaller p value, e.g.
near to 0,000 000 001
= 10^-9 or (perhaps)
p<0,000001 = 10^-6
(although I do not rule out the possibility that some other p-value might,
PERHAPS, suffice for rejecting null hypotheses in single experiments, say p<0,0001 (?), or p<0,001 (??) but THAT MUST
BE PROVED in the first place!)
[I wrote about the above problems in 1981 to 1989 (see the References below: Soric
B., 1981, 1989). Other authors also wrote about the incorrect understanding of the meaning and usefulness of statistical significance
(for example: Iyengar S. and Greenhouse J. B. 1988; Morrison D. E and Henkel R. E. 1973; Oakes M. W. 1986; Soric B. and Petz
B. 1987; see References, below)].
Accordingly, in what manner should the researchers act?
It is not bad to publish
results with the achieved p-values about 0,05 to 0,001 (or the like), but these should not be considered as sufficiently-verified
discoveries! Instead, such results should be understood only as "proposals" for further verification (until, perhaps, the
really-sufficient level of significance is established for single experiments). If an alternative hypothesis is really true,
it will be easy to reach a much-higher significance level by repeating such a single experiment on larger samples;
OR,
large-enough sets of experiments can be repeated in order to achieve a small-enough Qmax proportion (possibly even at very
low significance levels, such as, e.g.: p=0,05 or p=0,1 or 0,2 etc.). Unless the experiments are repeated, the results must
not be considered true discoveries, even if extremely-high significance levels are attained, because of the possible (unintentional)
systematic errors in gathering the data (or some other possible incorrectness or mistake).
************
This
text (as well as the more extensive one) contains mainly those explications which had to be omitted, for the sake of briefness,
in my previously published works (see the References below: Soric B., 1981, 1989).
In addition, I shall here give a more-general
formula, which makes it possible to calculate a Qmax value when the number (n) of experiments is unknown.
Other authors
have also dealt with the problems of inference based on statistical testing (see the References below).
I don't know
if my efforts will help to change things for the better. Nevertheless, I am writing this, because it might be even less useful
to give up trying.
I am publishing this text without having asked anybody to review it, because all the essential
topics have already been published in my previous articles after having been approved by competent reviewers. Still, due to
the lack of a new review, THERE MAY BE MISTAKES IN THIS TEXT, and I beg the readers to alert me about the possible mistakes
in order that I can correct them.
THE END OF THE SURVEY
(I hope to publish here a more-or-less-extensive text
in a few weeks or months).
REFERENCES:
Pearson K.: "Science and Monte Carlo", Fortnightly Review, Februray 1894
Hogben L.: Mathematics for
the Million, Pan Books Ltd., London 1967., p. 589.
Petz B.: Osnovne statisticke metode za nematematicare, 3. izdanje,
Naklada Slap, Jastrebarsko 1997., pp.126. to 138.
Serdar V.: Udzbenik statistike, Skolska knjiga, Zagreb 1977., p.
306.
Soric B.: "Kritika statistickog odlucivanja", Zdravstvo, 23, 1981. (pp. 143.-153.)
Soric B.: "Poboljsanje
metode i kontrola ispravnosti statistickog odlucivanja", Zdravstvo, 23, 1981. (pp. 154-170.)
Soric B. i Petz B.: "Koliki
postotak znanstvenih otkrica nisu otkrica?", Arhiv za higijenu rada i toksikologiju, 38, 1987. (pp. 251-260.)
Soric
B.: "Statisitcal 'Discoveries' and Effect-size Estimation", Journal of the American Statistical Association, Vol. 84, no.
406 (Theory and Methods), 1989 (pp. 608-610.)
Morrison D. E. and Henkel R. E. (eds.): The Significance Test Controversy
(2nd ed.), Aldine, Chicago, 1973
Oakes M. W.: Statistical Inference: A Commentary for the Social and Behavioural Sciences,
John Wiley, 1986, New York
Moore D.S.: Statisitcs Concepts and Cotroversies, 4th ed., W. H. Freeman and Company, 1997
New York
Vrhovac B., i dr.: Klinicko ispitivanje lijekova, Skolska knjiga, Zagreb, 1984. (pp.27-28., 65.)
Iyengar
S. and Greenhouse J. B.: "Selection Models and the File Drawer problem", Statistical Science, 3, 1988 (pp. 109-135.)
************
Some links (added on July 17, 2009)
http://www.jstor.org/pss/2289950
Sorić B.: "Statistical 'Discoveries' and Effect-size Estimation", Journal of the American Statistical
Association, Vol. 84, No. 406 (Theory and Methods), 1989 (str. 608-610.)
-----------------------------------------------------------
http://www.bepress.com/uwbiostat/paper259/
http://www.bepress.com/cgi/viewcontent.cgi?article=1092&context=uwbiostat
UW Biostatistics Working Paper Series, University
of Washington, Year 2005 Paper 259 / Storey, John D.: The Optimal Discovery Procedure:
A New Approach to Simultaneous Significance
Testing / 3 Optimal Discovery Procedure: Theory / 3.1 Optimality goal
(Page 5) "(......) ....expected number of false positives (EFP). (......) Similarly, the sum of powers across all true alternative hypotheses is the ETP. Even
though there are many ways in which one can combine these values in order to assess the performance of multiple significance
tests, this particular one is focused on the overall “discovery rate” (Soric 1989). (......) An exact equality exists for large numbers of tests
with certain convergence properties (Storey et al. 2004), under Bayesian mixture model assumptions (Storey 2003), and under
alternative definitions of the FDR (Benjamini & Hochberg 1995, Storey 2003) (......)" 6.2 False discovery rate optimality
by the ODP (Page 16) "(......) The FDR is the proportion of false
positives among all tests called significant (Soric 1989, Benjamini & Hochberg 1995) (......)"
-----------------------------------------------------------
http://www.math.tau.ac.il/~ybenja/MyPapers/benjamini_hochberg1995.pdf
J. R. Statist.
Soc. B (1995) 57, No. 1, pp. 289-300 / Controlling the--- False Discovery Rate: a Practical and Powerful
Approach to Multiple -Testing / By YOAV BENJAMINI and YOSEF HOCHBERG / Tel Aviv University, Israel [Received January 1993. Revised March 1994]
(Page
290) "(......) In this work
we suggest a new point of view on the problem of multiplicity. (......) ....a desirable error rate to control may be the expected
proportion of errors among the rejected hypotheses, which we term the false discovery rate (FDR). This criterion integrates
Spjotvoll's (1972) concern about the number of errors committed in multiple-comparison problems, with Soric's (1989 concern
about the probability of a false rejection given a rejection. We use the term FDR after Soric (1989), who identified a rejected
hypothesis with a 'statistical discovery' (......)"
-----------------------------------------------------------
http://genomebiology.com/2006/7/3/401
PMC Biophysics / Genome Biology
A reanalysis of a published Affymetrix GeneChip
control dataset
Alan R Dabney and John
D Storey
Department of Biostatistics, University of Washington, Seattle,
WA 98195, USA
Genome
Biology 2006, 7:401 doi:10.1186/gb-2006-7-3-401
Published: 22 March 2006 "(......)
False-discovery rates were originally proposed by Soric [2] and Benjamini and Hochberg [3]. The g-value was developed as the FDR analog of the p-value [4-7]. There is sound statistical justification behind both FDR and g-value
methods (......)
-----------------------------------------------------------
http://www.vanbelle.org/
Statistical Rules of Thumb
http://www.vanbelle.org/rom/ROM_2002_06.pdf#search=%22FDR%20Soric%22
(Page 2) "(......) Hochberg (see Benjamini and Hochberg, 1995)
made a fundamental contribution to the multiple comparison problem by defining the False Discovery Rate (FDR). Their work can be linked to a seminal paper by Sorić (1989). Rather than fixing the Type I error rate he
proposed fixing the rejection region. (......) The Hochberg approach has found particular usefulness in situations where there
are many multiple comparisons
such as in microarray analysis with hundreds or even thousands of comparisons. Storey (2002) has sharpened the Hochberg procedure
(......)"
-----------------------------------------------------------
http://www.stat.berkeley.edu/tech-reports/633.pdf#search=%22FDR%20Soric%22
Resampling-based multiple testing
for microarray data analysis
Yongchao Ge, Sandrine Dudoit, and Terence
P. Speed; Jan.
2003 Technical Report # 633 / Department of Statistics, University of California,
Berkeley / Division of Biostatistics,
University of California, Berkeley / Division
of Genetics and Bioinformatics, The Walter and Eliza Hall Institute of Medical Research, Australia /
(Page 3)
"(......) Since a typical microarray experiment measures expression levels for several thousand genes simultaneously,
we are faced with an extreme multiple testing problem. (......)" (Page 4)
"(......) The present paper introduces a new algorithm for computing the Westfall
& Young (1993) step-down minP adjusted p-values. A second line of multiple testing is developed by Benjamini &
Hochberg (1995). They propose procedures to control the false discovery rate. This was further developed by Storey (2002)
(......)" (Page 21)
Benjamini & Hochberg (1995) suppose that V=R = 0 when R = 0, while Storey (2002) uses the conditional expectation
of V=R given R > 0, termed the positive false discovery rate. Earlier ideas related to FDR can be found in Seeger (1968)
and Sorić (1989) (......)".
-----------------------------------------------------------
http://www.stat.purdue.edu/~tlzhang/mathstat/pvaluerev.pdf
On the False Discovery Rates of a
Frequentist: Asymptotic Expansions
Anirban DasGupta and Tonglin Zhang, Department of Statistics, Purdue University (2006)
(Page 1) "Abstract: Consider a testing problem for the null hypothesis (......) The standard frequentist
practice is to reject the null hypothesis when the p-value is smaller than a threshold value (alpha), usually 0.05. We ask
the question how many of the null hypotheses a frequentist rejects are actually true.
(......) We show that the Benjamini-Hochberg FDR in fact converges to
(delta n) almost surely under g for any fixed n. For one-sided null hypotheses, we derive a third order asymptotic expansion for (delta n).... (......) 1. Introduction - In a strikingly interesting short note, Sorić [19] raised the question
of establishing upper bounds on the proportion of fictitious statistical discoveries in a battery of independent experiments.
Thus, if m null hypotheses are tested independently, of which mo
are rejected at a significance level (alpha), and another S among the
false ones are also rejected, Sorić essentially suggested
E(V)/(V +S) as a measure of the false discovery rate in the chain of m independent
experiments. Benjamini and Hochberg [3] then looked at the question in much greater detail and gave a careful discussion....
(......) The practical importance comes from its obvious relation to statistical
discoveries made in clinical trials, and in modern microarray experiments. The continued importance of the problem is reflected
in two recent articles, Efron [5], and Storey [21], who provide serious Bayesian connections and advancements in the problem.
See also Storey [20], Storey, Taylor and Siegmund [23], Storey and Tibshirani [22], Genovese and Wasserman [10], and Finner
and Roters [9], among many others in this currently active area.
"Around
the same time that Sorić raised the issue of fictitious frequentist discoveries made by a mechanical adoption of the
use of p-values, a different debate was brewing in the foundation literature. Berger and Sellke [2], in a thought provoking
article, gave analytical foundations to the thesis in Edwards, Lindman and Savage [4] that the frequentist practice of rejecting
a sharp null at a traditional 5% level amounts to a rush to judgment against the null hypothesis. (......)".
------------------------------------------------------------------------------
imsart ver. 2006/01/04
file: pvaluerev.tex date: April 9, 2006
---------------------------------------------------------------------------------
|